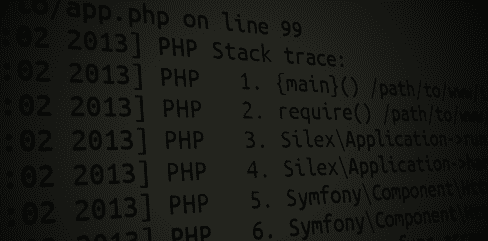
Quick Stack Trace In PHP With XDebug
Wat happened?
The other day I was dealing with an issue where a php script was outputting a white page.
Browsing error logs proved useless and there was nothing indicating why this was happening.
I remembered the environment had the excellent Xdebug module installed.
Xdebug
It has many features that make debugging php a bit easier.
I turned on xdebug.profiler_enable_trigger, which lets you selectively turn on the profiler by passing in a GET/POST parameter of XDEBUG_PROFILE.
Profiling
Hitting the script with http://example.com/script.php?XDEBUG_PROFILE created a profile in /tmp.
Being too lazy to setup Webgrind or kcachegrind, I tried to load the file in my editor of choice: vim.
I figured there'd be a way to read the call graph...but the profile's format wasn't meant to be human readable.
PHP's shutdown function
Curiously, the last function call was register_shutdown_function.
I had forgotten that this function existed.
Exception === stack trace
But another thought came to mind. It went a little something like this:
<?php
function shutdown()
{
  throw new Exception('kablooey');
}

register_shutdown_function('shutdown');
Bam, stack trace!
Thank you Xdebug.
The offending code
For your information, the offending code looked like this:
<?php
// some random function called deep in the stack
if ($something) {
  die('');
}
In summary...
- install xdebug
- register_shutdown_function + throw exception
- win all the internets

